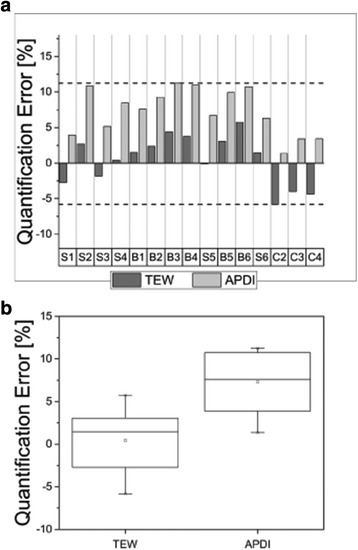
Fig. 2.

Quantification errors for phantom inserts with different shapes and volumes scanned in air (a), and error distribution for both scatter correction methods, TEW and APDI (b). The horizontal dashed lines in (a) mark the range (maximum and minimum) of the deviations from the truth. The boxes in (b) represent the range of variation (interquartile range-IQR) of the distributions
