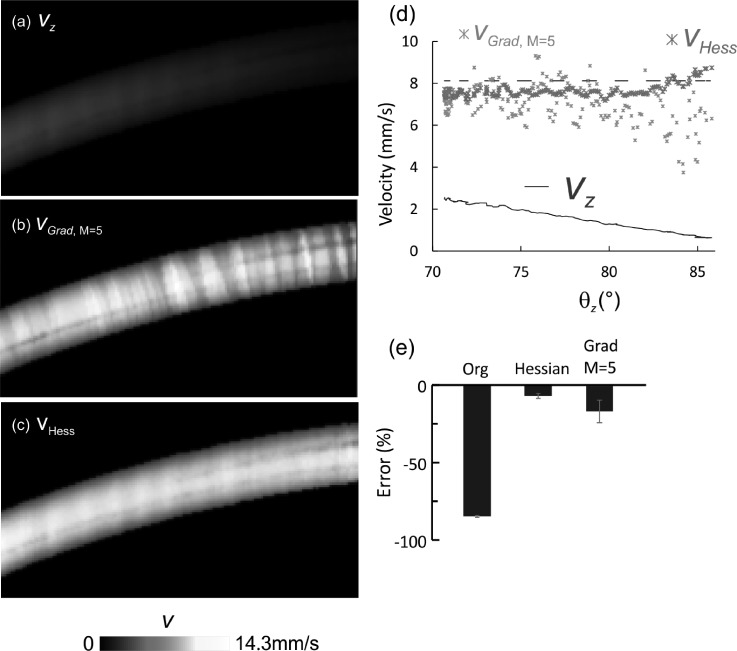
FIG. 3.
3D θz correction for phantom flow with 1% intralipid in a ф280 μm micro tubing at a pump rate of 30 μl/min or vp = 8.12 mm/s. (a) Side view of original flow image acquired by 3D μODT at 25 kHz A-line rate. (b) Flow image after θz correction with Gradient tracking method. (c) Flow image after θz correction with Hessian method. (d) Comparison of flow rates with θz among original flow velocity vz (blue), after Hessian correction vHess (red), gradient tracking vGrad (green) (M = 5), and pump rate vp (dashed black). (d) Errors before and after Hessian or gradient tracking correction (80° ≤ θz ≤ 81°).

