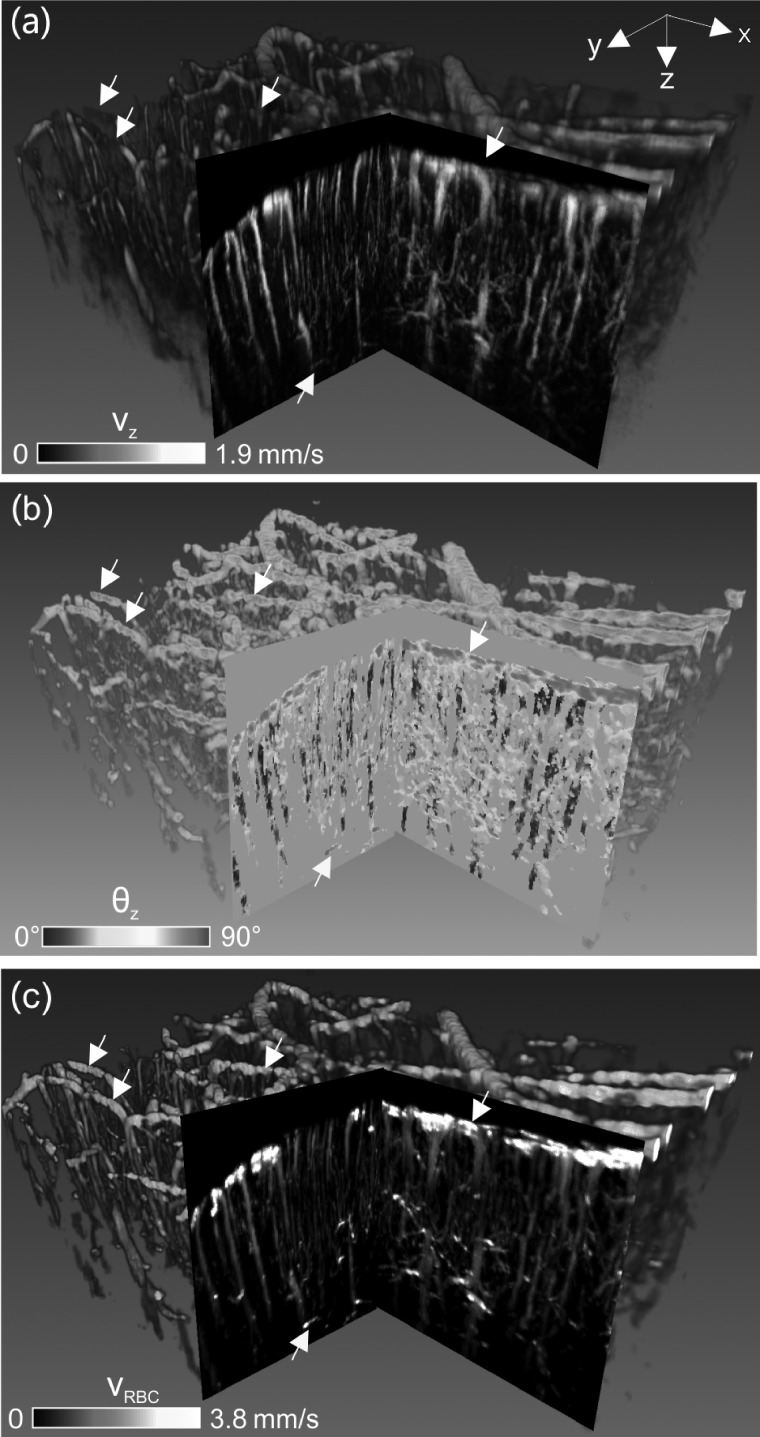
FIG. 4.
3D CBFv network image of mouse sensorimotor cortex (2.4 × 2.0 × 1.4 mm3) before and after θz correction. (a) Raw 3D μODT image (i.e., vz) without θz correction, (b) 3D Doppler angle θz image, (c) 3D absolute vRBC image after θz correction by 3D Hessian matrix. Yellow arrow: horizontally oriented capillary flow in deep cortex usually undetectable without angle correction; white arrows: correction of pial flows. 2D pie-cut images are MIP images of 200 μm-thick sub-volume.

