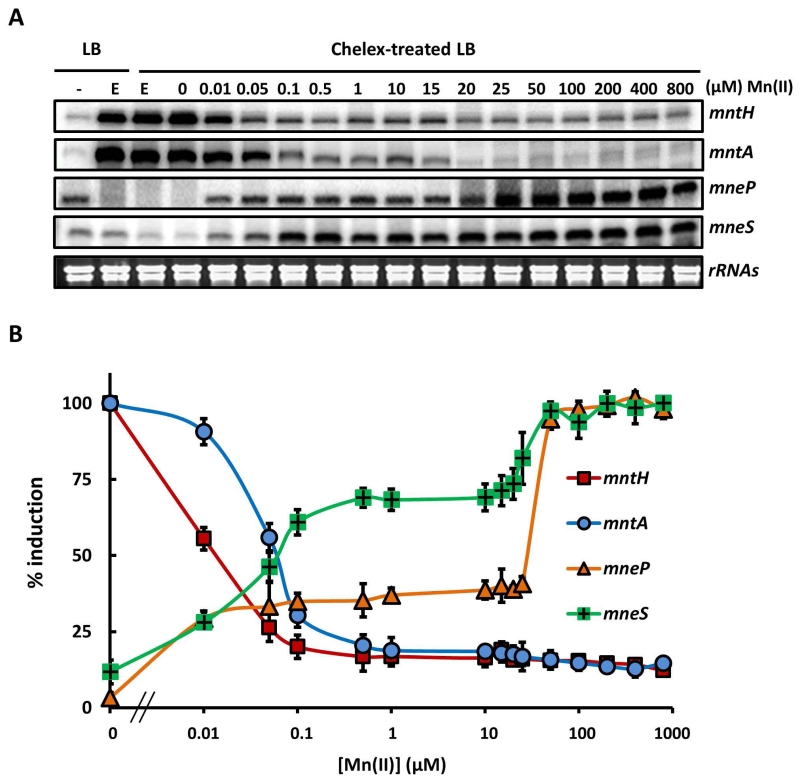
Fig. 5. The Mn(II) concentration required for activation of efflux is higher than that for repression of uptake.
(A) S1 nuclease protection was used to quantify transcripts for the mntH, mntA, mneP and mneS genes in RNA isolated from WT cells treated with Mn(II) as indicated. Cells were grown in LB to OD600 ~0.4 and an untreated sample taken (left lane, -). The remaining cells were treated with 1 mM EDTA for 30 min to induce Mn(II) limitation (E). These Mn(II) limited cells were washed 3 times with chelex-treated Milli-Q water to remove EDTA and then re-suspended in LB medium depleted of metals by prior treatment with Chelex-100 resin (Bio-Rad). These cells were then grown for 30 min. in this medium amended with Mn(II) to the final concentration indicated. Ribosomal RNAs of each sample are shown as controls to indicate the quality of RNA samples. (B) Transcripts from each sample in panel (A) were quantified and are presented as % induction relative to the fully induced levels from three independent experiments. The Mn(II) concentration for half maximal repression or activation of each gene was determined to be: mntH, 17.5 nM (±1.2); mntA, 62.5 nM (±2.6); mneP, 21.9 μM (±1.1) and mneS, 65.6 nM (±3.1).

