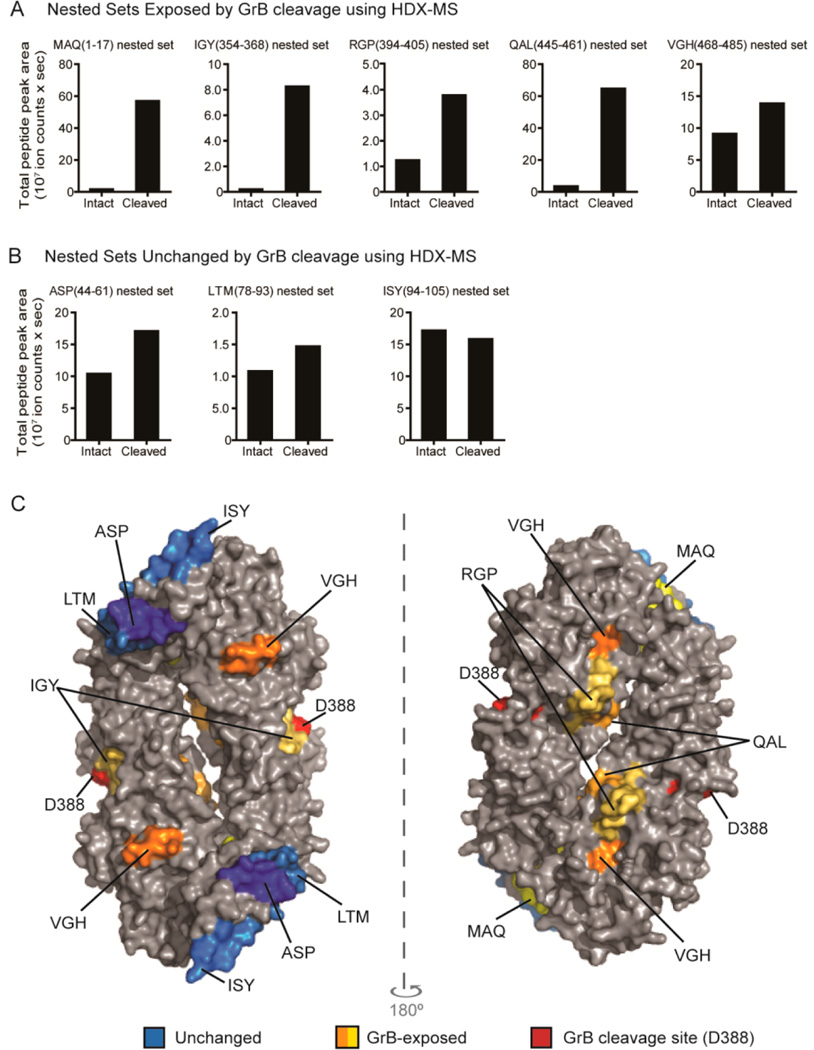
Figure 4.
GrB cleavage of PAD4 enhanced the presentation of GrB-exposed epitopes. The normalized amount of PAD4 peptides in each nested set derived from intact PAD4 or GrB-cleaved PAD4 using the cell-free system is shown as “total peak area”. Nested sets were grouped according to whether they were derived from regions of PAD4 that were exposed by GrB cleavage (A) or remained structurally unchanged following GrB cleavage (B) using HDX. (C) The peptides identified by the cell-free system are indicated on a surface rendering of the PAD4 dimer (PBD ID: 1WDA)34 using PyMOL software. Peptides derived from regions that did not change following GrB cleavage by HDX are indicated as “unchanged” (blue area). Peptides that were derived from regions that changed with GrB cleavage are indicated as “GrB-exposed” (orange and yellow areas). The GrB cleavage site is shown (red area).

