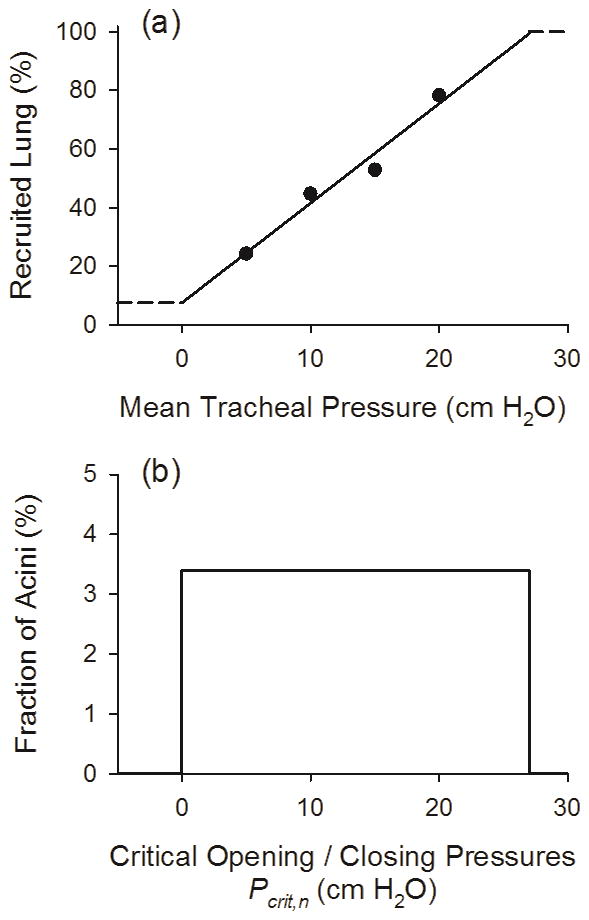
Fig. 1.

(a) Percentage of recruited lung vs. mean tracheal pressure. Symbols are computed from the experimental data of Kaczka et al. [13], as the ratio healthy to injured dynamic elastance multiplied by 100%. Solid line is the linear regression for the four data points, with horizontal dashed lines denoting the imposed upper and lower limits of recruitment. Thus the model assumes that 7.6% of the lung is recruited at a mean tracheal pressure of 0 cm H2O, while 100% of the lung is recruited at about 28 cm H2O. (b) Distribution of acinar critical opening / closing pressures (Pcrit,n), expressed as the fraction of total acini in the model. This distribution is computed as the slope (i.e., derivative) of the function in (a).
