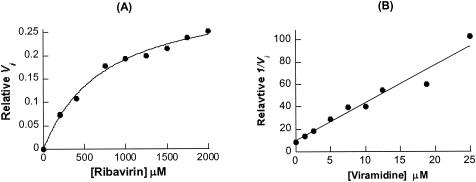
FIG. 2.
Kinetic analysis of ribavirin phosphorolysis catalyzed by nucleoside phosphorylase and inhibition of the reaction by viramidine. The initial velocity of a reaction was determined by a PhosphorImager to integrate the pixel number of the product band on TLC. Kinetic parameters reported are the average of three sets of results. One representative data set is shown here. (A) Michaelis-Menten curve of ribavirin phosphorolysis catalyzed by human blood purine nucleoside phosphorylase (2.5 U/ml). The data were used to calculate the Km and kcat values for the reaction. (B) Dixon plot of inhibition of ribavirin phosphorolysis by viramidine (1 to 25 μM). In the experiment, the ribavirin concentration was constant (100 μM). The plot was used to calculate the Ki value for viramidine.

