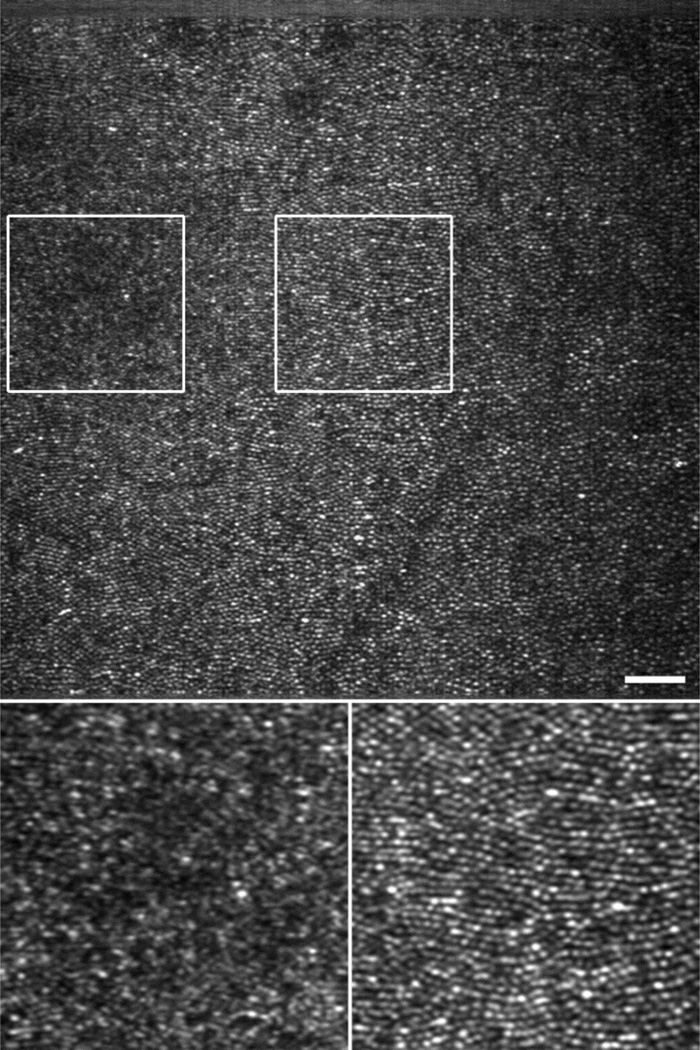
Fig. 4.
AOPCSO human retinal image acquired at 100 FPS. Top panel is a single frame (Visualization 1). Signal frame SNR, as assessed by the ratio of the mean to the standard deviation of the pixel values, is 2.0. Bottom panels are enlarged view (single frame) of the retina indicated by the boxes on the top panel. The box on the left contains the foveal center, showing resolved foveal center cones, which may be better viewed in the registered image (Visualization 2). Scale bar is 50 µm.

