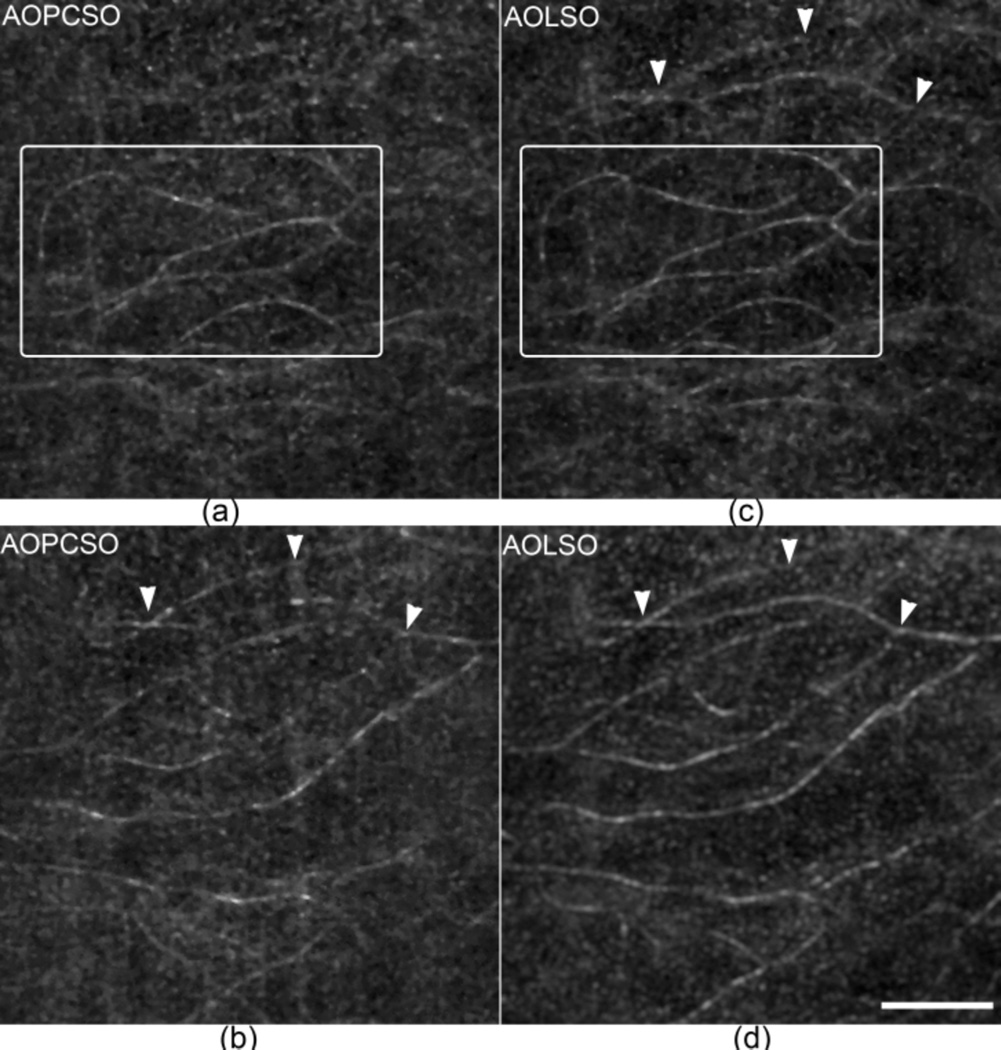
Fig. 5.
Comparison of the depth discrimination ability of AOLSO and AOPCSO. (a) and (b) are AOPCSO images of retinal capillaries taken at two retinal layers with a depth difference of approximately 73 µm. (a) is close to the photoreceptors and (b) is close to the nerve fiber layer. (c) and (d) are AOLSO images taken at the same layers corresponding to (a) and (b), respectively. The boxes in panels (a) and (c) contain retinal capillaries in the same layer revealed in the two imaging modes. The arrowheads indicate capillaries that are visualized in both AOLSO and AOPCSO images. All images were acquired at 100 FPS and 60 successive frames were registered to extract the retinal blood vessels. Scale bar represents 100 µm and applies for all images.

