
Fig. 4.
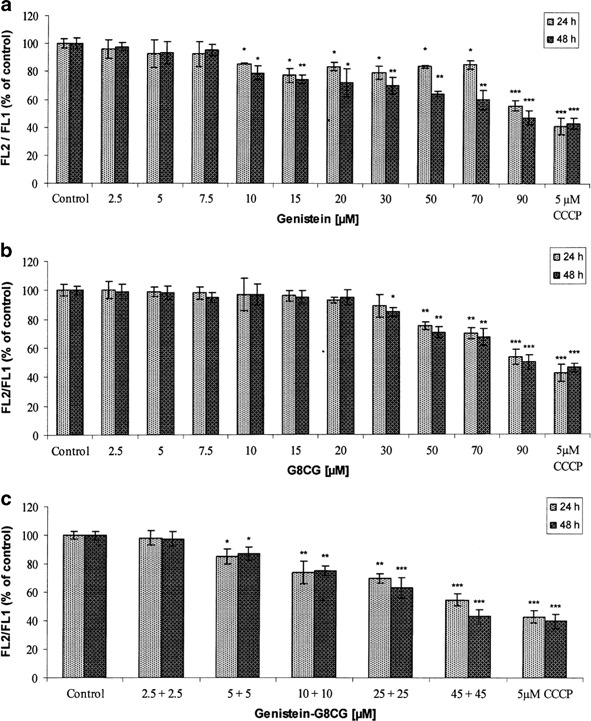
Loss of mitochondrial membrane potential (ΔΨm) after 24 and 48 h exposure of SK-OV-3 cells to: a genistein; b G8CG; c genistein-G8CG. The calculated ratio of FL2 vs. FL1 of each sample is depicted. The data are expressed as a percentage of the control value (value obtained for untreated cells). Each result represents mean±SD, n = 4, *p < 0.05, **p < 0.01, ***p < 0.001