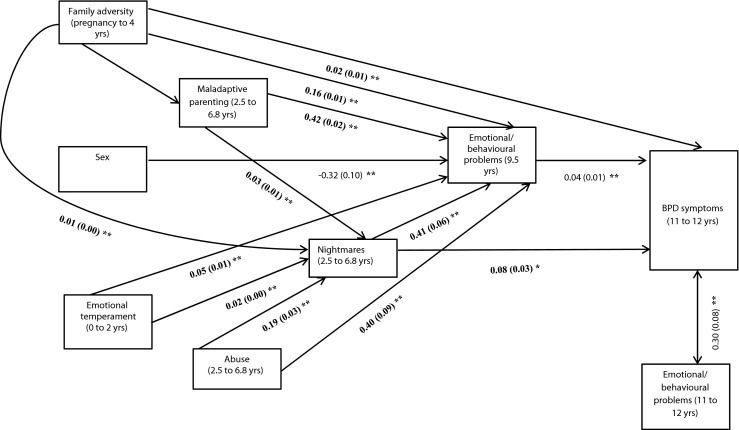
Fig. 2.

Path diagram showing the main significant direct associations in the final model. Pathways to emotional/behavioural problems at 11 to 12 not shown for clarity; * = significant at p < 0.05; ** = significant at p < 0.001; Results presented in probit co-efficients; Probit co-efficients represent the change in the probability of “caseness” associated with a unit change in the independent variable, thus it is important to keep the scale of the predictor in mind when interpreting probit coefficients i.e., one would expect probit values to be larger for dichotomous predictors, which represent the change from ‘no caseness’ (i.e., no abuse) to ‘caseness’ (i.e., abuse) rather than a single value on a continuous scale (i.e., emotional/behavioural problems)
