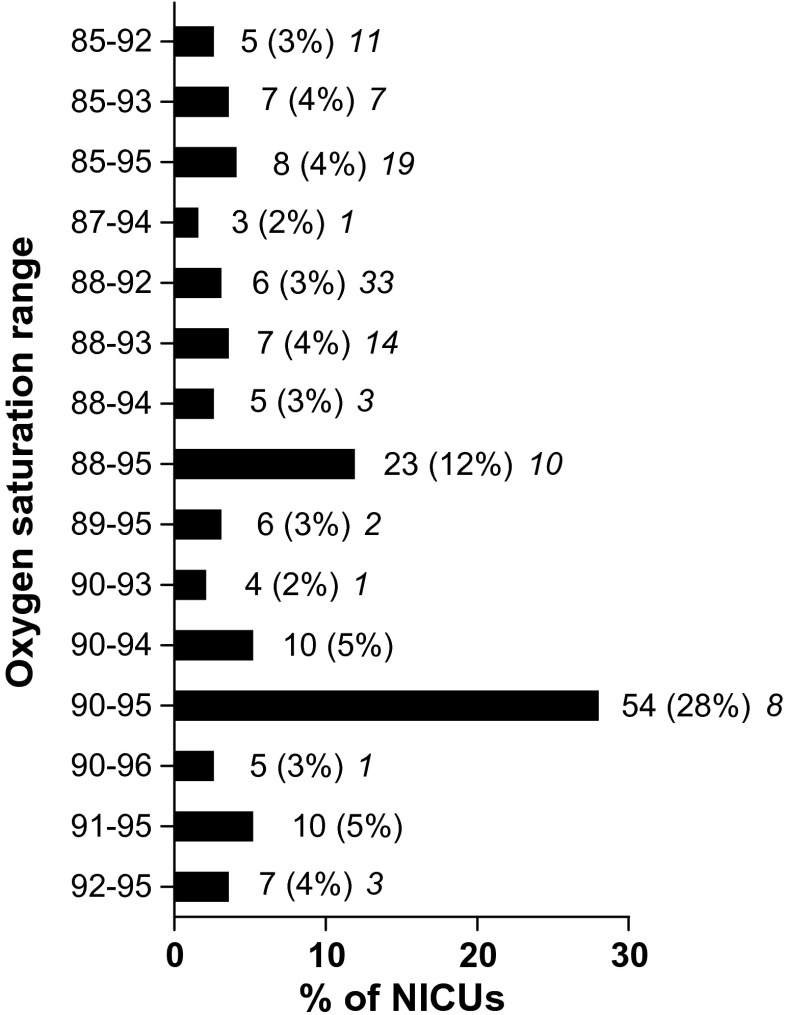
Fig. 1.
Current SpO2 ranges used in 193 European NICUs. Results are expressed as n (%). The number in italic indicates the number of NICUs having the same range over the last 10 years. For clarity, ranges reported by only one or two NICUs are not shown in the figure. Limits used in only one center are 82–93, 85–97, 86–93, 86–94. 86–95, 86–96, 87–92, 88–97, 89–92, 89–96, 90–92, 90–97, 90–98, 91–96, 92–94, 93–98, and 94–99. Limits used in two centers are 83–93, 85–90, 86–92, 87–93, 87–95, 88–96, 89–94, and 95–96

