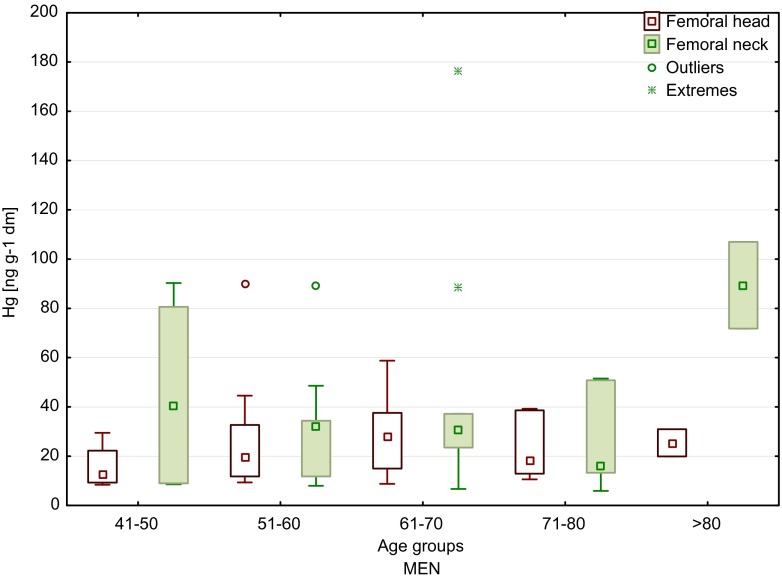
Fig. 2.
Median values of mercury content of the femoral head and neck of men, depending on age (boxes indicate upper and lower quartile, whiskers indicate minimum and maximum values, open circles indicate outlier values, and asterisks indicate extreme values). No significant difference between the groups

