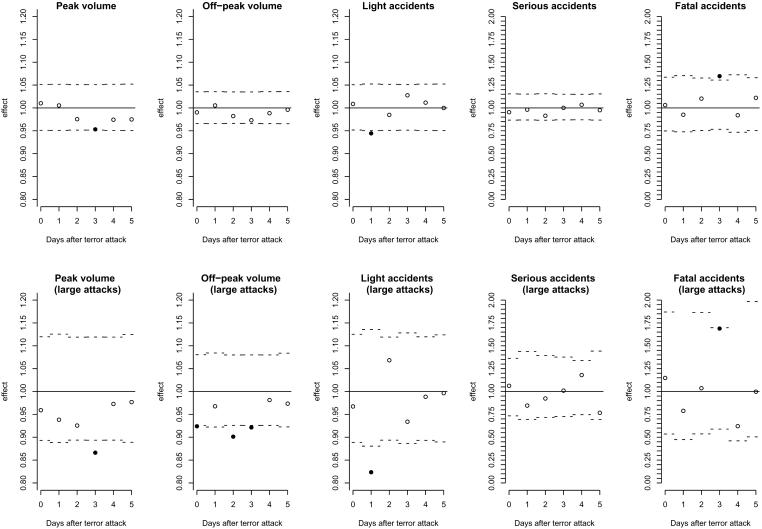
Fig. 3.
Model estimates of proportional effects of terror attacks on traffic volume and accident rates by number of days after attack. (Upper) Results for all attacks. (Lower) Large attacks only. Open circles indicate statistically insignificant effects; filled circles indicate effects that are individually significant at the 5% level; circles that lie outside of the dashed interval are statistically significant at the 10% level using the Bonferroni adjustment for multiple comparisons. See text for details.

