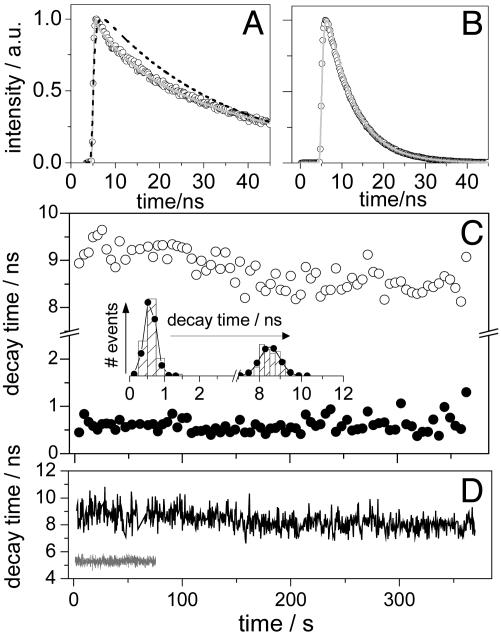
Fig. 3.
Time-resolved single-molecule data for PN16. (A) Multiexponential fluorescence decay (filled circles) of a single PN16 molecule in PS. Also shown are the single (black dashed line) and multiexponential (gray line) fits. a.u., Arbitrary units. (B) Single-exponential fluorescence decay (filled circles) of a single PN16 molecule in ZE. Fit is shown in gray. (C) Forward (filled circles) and reverse (open circles) ET-related decay time trajectories of a single PN16 molecule in PS (10,000 photons per bin). (Inset) Graph of data from C featuring mean value and width of 0.6 and 0.4 ns for forward ET and of 8.6 and 0.9 ns for reverse ET. (D) Reverse ET decay time trajectory (black, 500 photons per bin) of the single PN16 molecule in PS accounting for A and lifetime trajectory (gray, 500 photons per bin) of the single PN16 molecule in ZE accounting for B.

