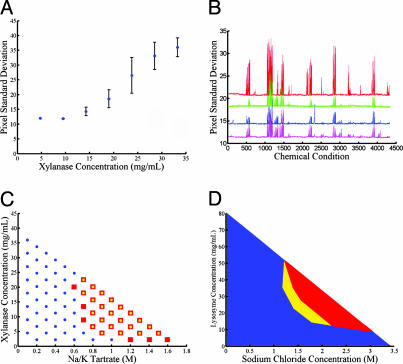
Fig. 4.
Automated exploration of protein solubility using the microfluidic formulator. (A) Precipitation measurements at varying concentrations of xylanase in 0.6 M potassium phosphate with 0.1 M Tris·HCl, pH 6.5. The standard deviation of pixel intensities provides a quantitative metric of protein precipitation in the ring reactor. Below the precipitation limit, the standard deviation shows constant background level with low variation. Above 12 mg/ml, the solution is in the precipitation regime, and the pixel standard deviation exhibits an approximately linear dependence on protein concentration. All points represent the mean of five identical experiments, with error bars indicating standard deviation of measurements. (B) Solubility fingerprints of xylanase over ≈4,300 chemical conditions. Each data series represents a separate fingerprinting experiment using the same basis of chemical conditions. The top solubility fingerprint (red) is generated by using a sample having elevated protein concentration (90 mg/ml) and exhibits both higher signal-to-noise ratio and additional peaks not present in the other data series (70 mg/ml). The two center solubility fingerprints were generated sequentially on a single device (first green, then blue) with the same loaded sample, demonstrating the stability of the protein over the time of the experiment (≈40 h). The bottom solubility fingerprint (pink) was generated on a separate device by using the same protein sample as the blue fingerprint, showing reproducibility across devices. (C) Comparison of xylanase phase mapping done on chip and in microbatch experiments. Conditions that gave rise to precipitation in microbatch format and in chip are represented by red squares and overlaid yellow circles, respectively. Conditions that did not produce precipitation in either format are shown as blue circles. (D) Reversibility of precipitation and solubility hysteresis for lysozyme observed by outward and return titrations from the origin. The red region shows the area of phase space in which precipitation was observed in both outward and return titrations. The yellow region is the area of hysteresis in which the protein was soluble for the outward titrations but precipitated in the return titrations. The blue region is the area in which the protein was soluble for both the outward and return titrations.

