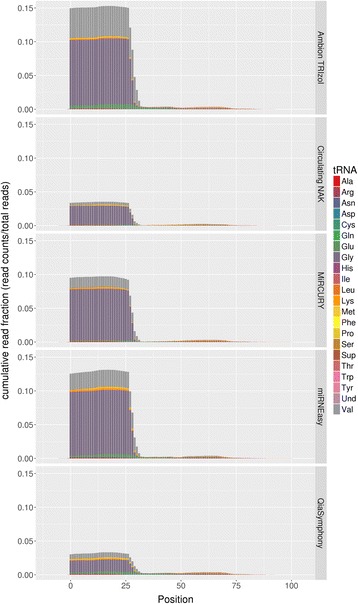
Fig. 5.

tRNA positional alignment distribution. Color indicates the tRNA by anticodon type. The x-axis denotes the position of tRNA from 0 to the end of tRNA. The y-axis denotes the cumulative read fractions. Visible quantity difference can be seen in the tRNA type detected by different kits. This suggests that there are selection bias of tRNA in by the kits
