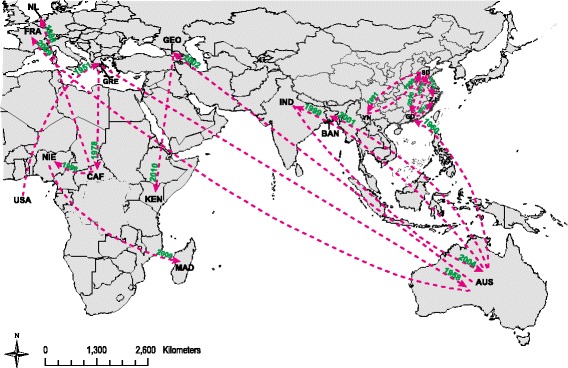
Fig. 4.

Geographic distribution and inferred dynamics of global E-14 strains. The map was reconstructed using the ArcGIS (http://www.esri.com/), and was identical to the original image created by the SPREAD and GoogleTM Earth. Arrows indicate the inferred routes of spread of global E-14. The number represented the time when E-14 arrived. Abbreviations of geographic location are shown as described in the legend of Fig. 2
