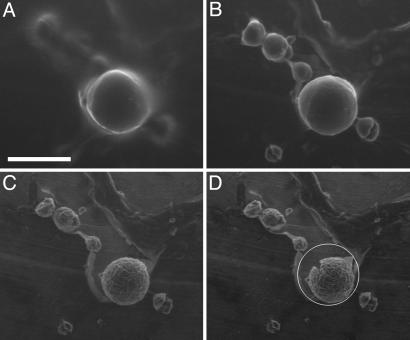
Fig. 3.
Changes in spherulite morphology on drying. ESEM images of a group of spherulites as the pressure is reduced from 5.4 to 4.8 Torr. (A) At 5.4 Torr, a spherulite becomes visible, surrounded by water. Smaller spherulites are apparent but ill defined. (B) At 5.3 Torr, most of the surface water has evaporated, although the spherulite surface is still smooth, possibly covered with water. The smaller spherulites, several of which have fractured into smaller pieces, are now clearly visible. (C) At 4.9 Torr, water has been removed from the spherulites; the surfaces are rough, and further shrinkage has occurred. (D) At 4.8 Torr, the sample is now drier still, and the larger spherulite has developed cracks. The white circle indicates the original size of the spherulite observed in A. (Scale bar, 100 μm.)

