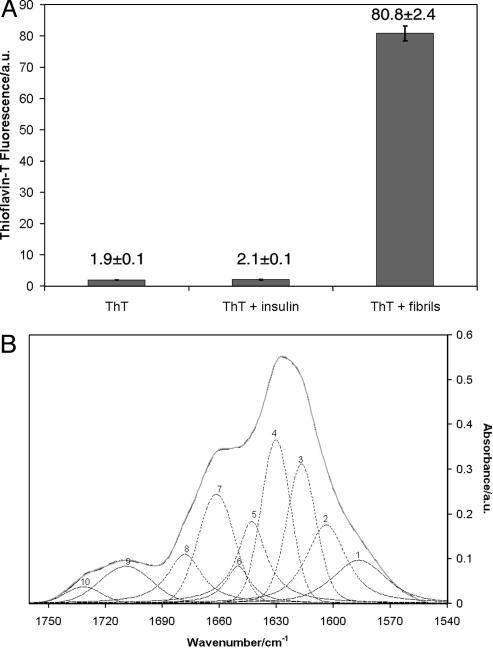
Fig. 5.
ThT fluorescence and FTIR spectra of insulin solutions containing spherulites. (A) Fluorescence of a solution of ThT only, of ThT with added insulin, before (ThT + insulin) and after (ThT + fibrils) incubation at 65°C for several hours. Three different solutions were used in each experiment. For clarity, the value and error of each measurement are shown on the graph. (B) FTIR spectra of pellets formed by centrifugation of solutions of insulin that were incubated at 65°C. The secondary structure content, based on fitted peak areas, is α-helix 17 ± 1%, β-sheet 53 ± 1%, random-coil 6 ± 0.5%, turns 24 ± 1%. Assignments are based on published procedures (49-51).

