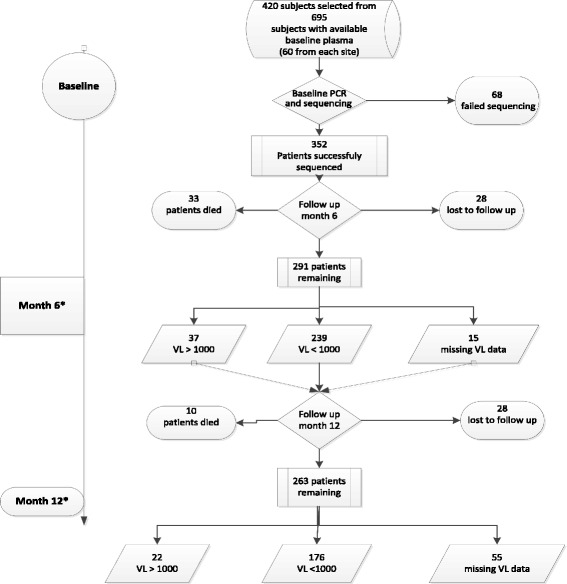
Fig. 1.

Flow chart of randomly selected patients. *Additional seven patients not included in the randomly selected group failed therapy and were included for the purpose of co-receptor switch analysis only. VL: viral load (copies/ml)

Flow chart of randomly selected patients. *Additional seven patients not included in the randomly selected group failed therapy and were included for the purpose of co-receptor switch analysis only. VL: viral load (copies/ml)