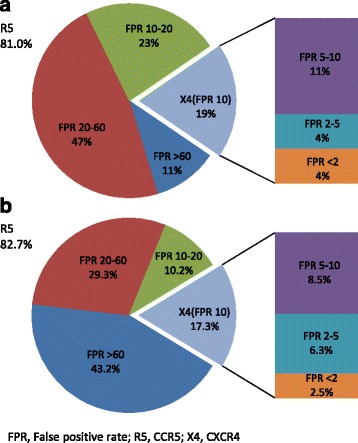
Fig. 2.

Proportions of patients with R5- or X4-tropic viruses by the geno2pheno clinical model (a) and by the geno2pheno clonal model (b). Pie plots represent: i) R5-infected (fpr >10%) patients by the fpr ranges: 10–20%, 20–60%, >60%; ii) X4-infected (fpr ≤10%) patients. Exploded bars represent the stratification of X4-infected patients according to the fpr ranges: < 2%, 2–5%, and 5–10%. FPR, False positive rate; R5, CCR5; X4, CXCR4
