Fig. 3.
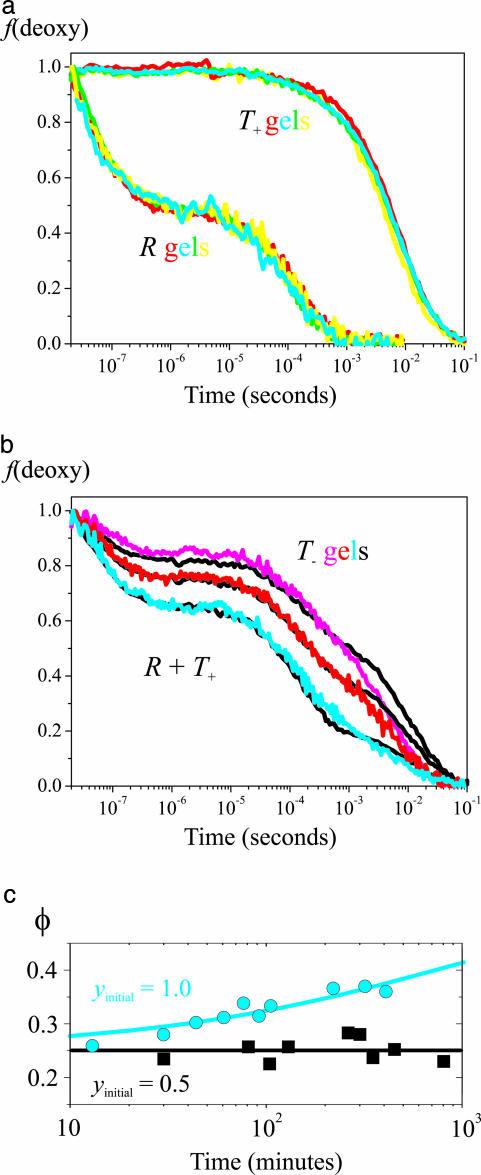
Ligand rebinding kinetics after photodissociation of the CO complex. (a) Kinetic progress curves are shown. Fraction of deoxyhemes [f(deoxy)] versus time on a logarithmic scale for T+ (Upper) and R (Lower) gels at different pHs but otherwise the same conditions as in Fig. 2 (yellow, pH 6.6; red, pH 7.0; green, pH 7.3; cyan, pH 7.6). (b) Fraction of deoxyhemes versus time on a logarithmic scale for T- gels (100 mM Hepes buffer/1 mM EDTA) at pH 7.6 (cyan), pH 7.0 (red), and pH 7.0 plus 200 mM potassium chloride (magenta). The black curves superimposed on the T- curves are linear combinations of the T+ and R curves. (c) Change of geminate yield for T- gel at pH 7.0 is shown. The geminate yield (φ) is plotted versus the time (on a logarithmic scale) after adding CO in the sample preparation to produce either 100% (cyan circles) or 50% (black squares) saturation. The cyan curve is a stretched exponential fit to the data with a time constant of 770 min, a stretching exponent of 0.5, a geminate yield at t = 0 of 0.25, and a geminate yield at t = ∞ of 0.49.

