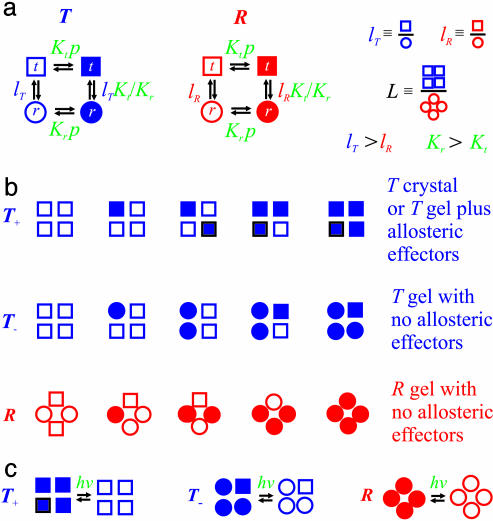
Fig. 4.
Interpretation of gel equilibrium and kinetic experiments in terms of the TTS allosteric model. The TTS partition function is (30)  . (a) Schematic description of the model. Open symbols, unliganded subunit; filled symbols, liganded subunit; circles, r tertiary conformation; squares, t tertiary conformation. Kt and Kr, affinities of the subunits in the t and r conformations in which the liganded subunits remain in t and r, respectively; lT, ratio of t-to-r populations of the unliganded subunits in the T quaternary structure; lR, corresponding equilibrium constant in the R quaternary structure; L, ratio of the T-to-R populations in which all of the subunits of T are unliganded t and all of the subunits of R are unliganded r. See Supporting Text for additional properties of the partition function. (b) O2 equilibrium binding experiments. Analysis of the O2-binding curves with the TTS model shows that, at pH 7.3, 80% of the oxygenated subunits switch from t to r, whereas the CO photolysis experiments indicate that 65% of the oxygenated subunits switch from t to r. For O2 binding to the R quaternary structure in the absence of allosteric effectors, all liganded subunits of R are in the r conformation. Fitting the solution kinetic data for CO rebinding with the TTS model predicts that ≈40% of the unliganded subunits in the R quaternary structure are in the t tertiary conformation (lR = 0.7) (30). Only one representative species from the most probable microstate, defined by the number of liganded and unliganded r and t subunits, is shown for each ligation state. (c) CO photolysis experiments on hemoglobin encapsulated in the gel. CO rebinding is complete in milliseconds before either tertiary or quaternary conformations change.

