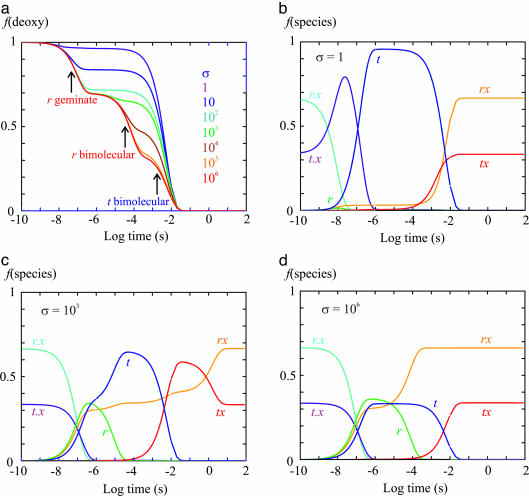
Fig. 5.
Simulation of kinetics after photodissociation. Table 2, which is published as supporting information on the PNAS web site, gives the rate coefficients used in simulating the kinetic and equilibrium experiments in the T- gel, together with those obtained from nanosecond photolysis studies of the CO complex (30) and the rate coefficients obtained for the overall binding and dissociation rates for CO and O2 (42). Difference in solution conditions of temperature and pH required only small adjustments to obtain rate coefficients that reproduced the gel photolysis and oxygen equilibrium data. Shown are the fraction of deoxyhemes, f(deoxy), as a function of time after photodissociation of T- molecules with varying values of the slowing factor σ (a) and the fraction of each of the six species in the T quaternary structure as a function of time after photodissociation of T- molecules with σ = 1(b), σ = 103 (c), and σ = 106 (d). The differential equations were solved by using the program mlab.

