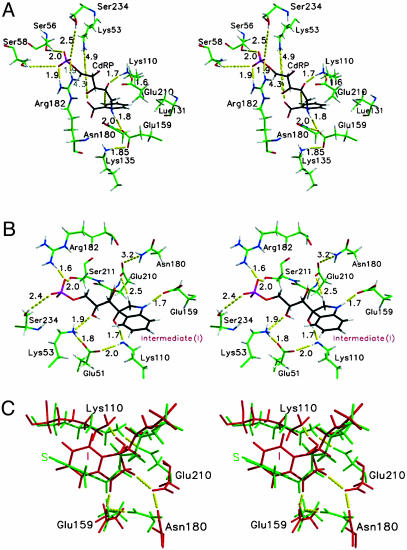
Fig. 4.
Stereoplot of the average structure from a MD simulation of E·S385 (A), E·In (B), and E·S385 (red) superimposed on E·In (green) (C). The carbon atoms of the substrate (CdRP) and In are shown in black for clarity. Note the hydrogen bond between Lys-110 and Glu-210 in A and the orientation of Glu-210 in B.

