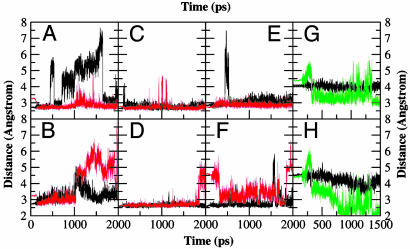
Fig. 5.
Plot showing important distances from MD simulations of E·S298, E·S385, and E·I. (A-F) Distance trajectories from the MD simulations of E·S298 (black) and E·S385 (red). The distances shown are between Lys-110-NH3+ and CdRP-O2′ (A), Lys-53-NH3+ and CdRP-O3T (B), Lys-110-NH3+ and Glu-51-CO2- (C), Glu-51-CO2- and Lys-53-NH3+ (D), Glu-159-CO2- and CdRP NH (E), and Arg-182 and CdRP-O1P (F). (G and H) The distance of the plausible general base candidates Glu-159-CO2- and Glu-210-CO2- from C1′ (black) and H1′ (green) of the In.

