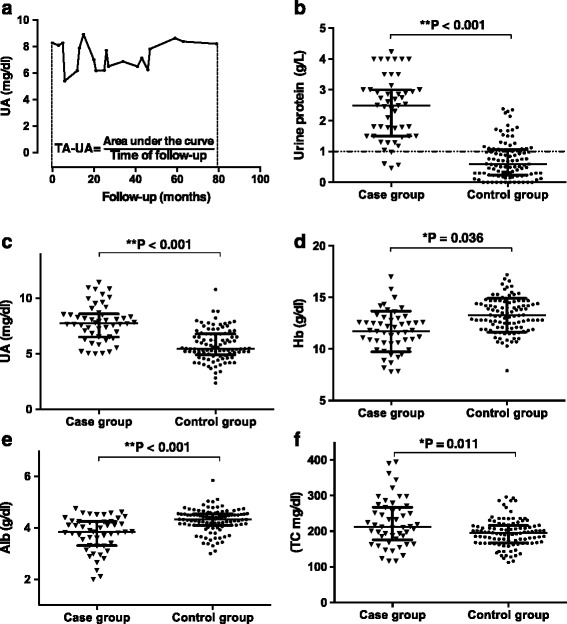
Fig. 1.

Clinical features during follow-up. a, Serial measurements of proteinuria during follow-up in one patient and the definition of TA-P for this patient. Comparison of TA-P (b), TA-UA (c), TA-Hb (d), TA-Alb (e) and TA-TC (f). Dotted lines present the normal range of each clinical feature. Median and interquartile range were presented in each figure
