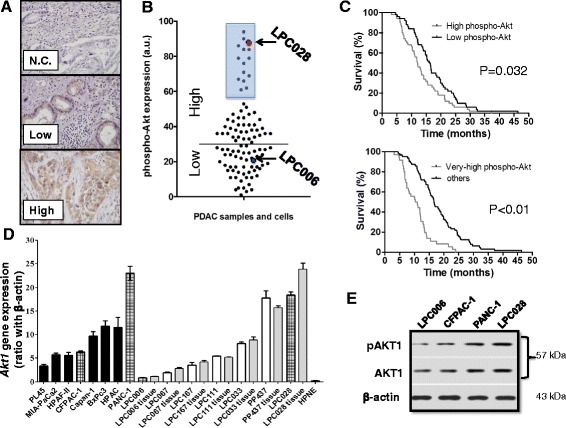
Fig. 1.

Akt/phospho-Akt expression in PDAC tissues and cells. a Representative examples (original magnification, ×40) showing the variable expression of phospho-Akt in paraffin-embedded PDAC samples collected in four TMAs (with 4 cores for each of the 100 patients). N.C., negative control. b Expression values of phospho-Akt observed across the cohort of PDAC patients, obtained by digital quantification. Phospho-Akt showed positive cytoplasmic and nuclear staining in most tissue sections, with intense staining in 14 out of 100 samples. The staining intensities of the LPC028 and LPC006 cells were included in the very high and low Akt expression groups, respectively. c Kaplan–Meier survival curves according to the expression of phospho-Akt in 100 radically resected PDACs, showing that patients with high expression (upper panel) and very high expression (lower panel) of phospho-Akt had a significantly shorter survival compared to patients with low phospho-Akt expression. d Akt1 mRNA expression in ATCC cell lines (black bars), primary tumor cultures (white bars), and their originator tissues (gray bars). Dashed bars identify the cells that were selected for further in vitro studies; e Representative Western blot pictures of phospho-Akt1 and Akt1 expression in LPC006, CFPAC-1, PANC-1, and LPC028 cells. Columns, mean values obtained from three independent experiments, bars, SEM
