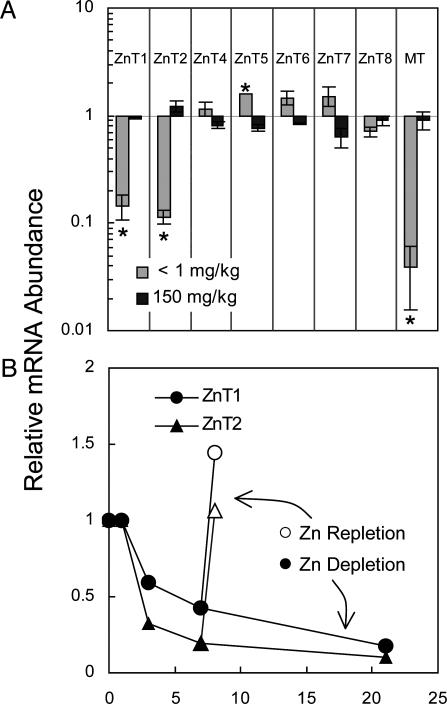
Fig. 4.
Q-PCR analysis of ZnT transcript abundance in mouse pancreas. Each relative abundance was calculated by using 18S rRNA as the normalizer. Values are given as means ± SEM (n = 3). (A) ZnT transcript levels in response to low (Zn-, 1 mg/kg) or high (Zn+, 150 mg/kg) Zn diets relative to the Zn-adequate (ZnN, 30 mg/kg) diet after the mice were fed for 21 days. *, P < 0.05, compared with ZnN group. Pancreatic MT mRNA is shown as an example of a Zn-responsive gene. (B) ZnT1 and ZnT2 transcript levels decrease as a function of Zn depletion over 21 days. After 7 days, one group of mice was repleted with Zn by feeding the ZnN (Zn-adequate) diet for 1 day.

