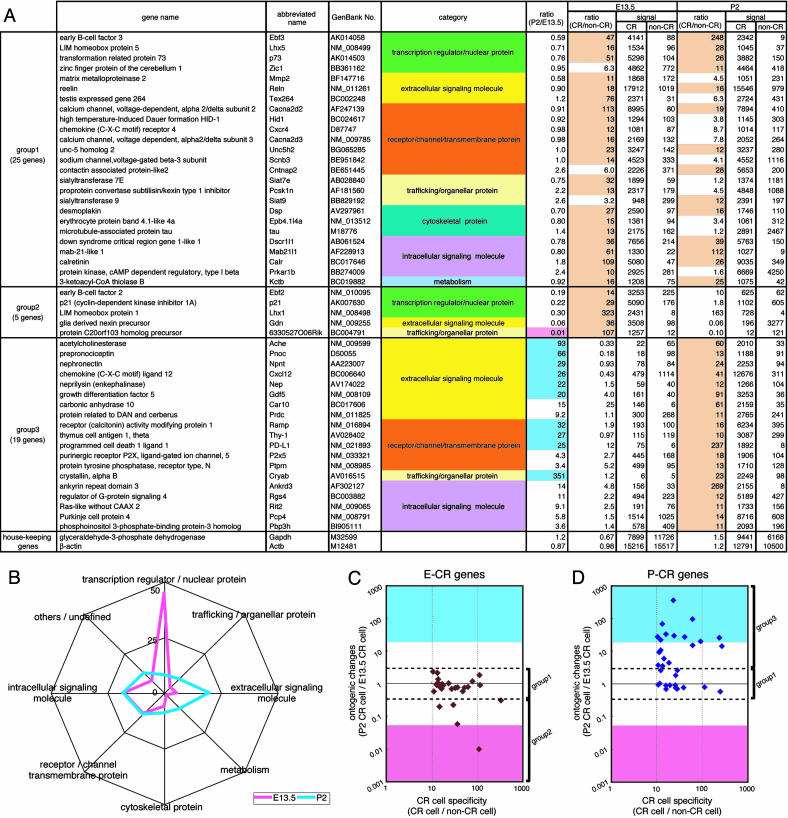
Fig. 2.
Gene-expression profile of CR cells at E13.5 and P2. (A) The 49 genes that exceeded hybridization signals by >10-fold (indicated with pale orange) between CR and non-CR cells at E13.5, P2, or both are listed. Relative ratios of hybridization signals of E13.5 CR cells to P2 CR cells [ratio (P2/E13.5)] and those of CR to non-CR cells at E13.5 and P2 [ratio (CR/non-CR)] were calculated from microarray-analysis data. The CR genes were classified into three groups according to ontogenic changes in expression levels between E13.5 and P2 CR cells. The functional category of each gene is indicated with different colors. The 11 genes that showed a >20-fold increase or decrease in hybridization signals in P2 CR cells compared with E13.5 CR cells are indicated with blue and pink in the ratio column (P2/E13.5), respectively. At the bottom, the data of two housekeeping genes are indicated for comparison. The full and abbreviated names of genes are taken from the GenBank database. (B) The functions of 131 genes at E13.5 (pink) and 111 genes at P2 (blue) in which hybridization signals were more than three times different between E13.5 CR cells and P2 CR cells were annotated on the basis of available databases (Tables 1 and 2), and the proportion of eight different categories is expressed as a percentage for each category. (C and D) The E-CR genes (27 genes) and the P-CR genes (33 genes), which had hybridization signals >10 times higher in CR cells compared with non-CR cells at E13.5 (C) and P2 (D), respectively, were separately analyzed. Relative ratios of the expression levels of P2 to E13.5 CR cells (ontogenic changes) were plotted against relative ratios of the expression levels of CR to non-CR cells (CR cell specificity). Group 1-3 CR genes are marked on the right side. Expression levels exceeding a 20-fold increase or decrease in P2 CR cells compared with E13.5 CR cells are indicated with blue and pink, respectively.

