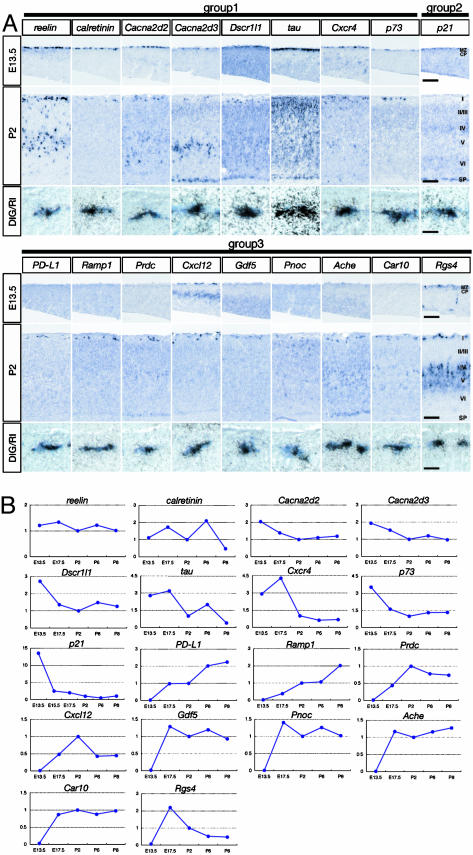
Fig. 3.
Analysis of in situ hybridization and temporal expression patterns of CR genes. (A) In situ hybridization analysis of CR genes was conducted in neocortical sections at E13.5 and P2, and the results are displayed in Top and Middle, respectively. CP, cortical plate; I-VI, layers 1-6; SP, subplate; DIG, digoxigenin. In Bottom, double in situ hybridization analysis in neocortical sections at E13.5 (Cacna2d3, tau, and p21) and at P2 (others) is indicated. (Scale bars: Top and Middle, 100 μm; Bottom, 10 μm.) (B) Temporal changes in expression levels of indicated CR genes were analyzed at five to six time points from E13.5 to P8. Expression levels at P2 were taken as 1 in all analyses.

