Fig. 4.

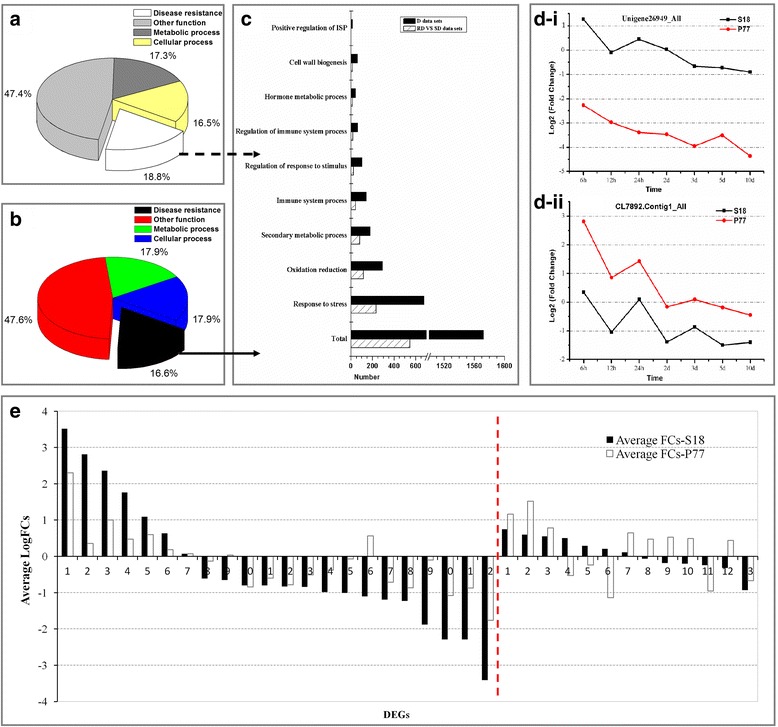
Genotype-common or genotype-specific transcriptional changes in DEGs in the resistant genotype (S18) and the susceptible genotype (P77). a Distribution of genotype-common transcriptional DEGs, modulated in RD and SD datasets into functional categories. b Distribution of genotype-common transcriptional DEGs, modulated in D datasets into functional categories. c Distribution of the genes involved in disease resistance, modulated in both genotypes into functional categories. d The dynamic trends of two DEGs involved in disease resistance. e 22 genotype-specific transcriptional DEGs encoded peroxidase (POD) in S18, 13 genotype-specific transcriptional DEGs encoded peroxidase (POD) in P77. The left side of the red line represents variations in the average fold-changes in genotype-specific transcriptional DEGs in S18, while the right side of the red line represents that in P77
