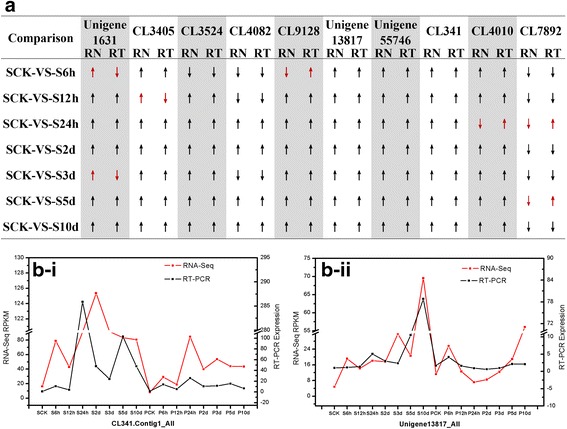
Fig. 5.

Comparison of RNA-Seq and the quantitative real-time PCR analyses for gene expression validation. The up arrow indicates the up-regulation of DEGs, the down arrow indicates the down-regulation of DEGs. RN indicates RNA-Seq, RT indicates qPCR. a Comparison of RNA-Seq and qPCR analyses for the genes expression validation in RD datasets. b The expression validation of DEGs (CL341.Contig1_All and Unigene 13817_ALL) using qPCR
