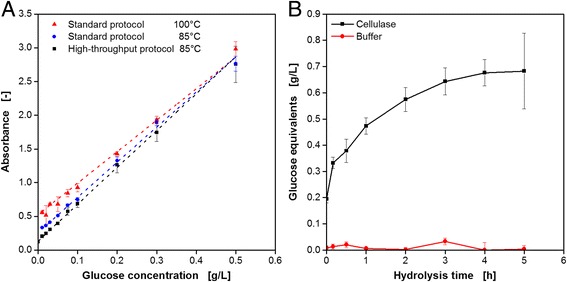
Fig. 5.

Adapting the reducing sugar assay PAHBAH for cellulose hydrolysis to automated HT conditions (according to Fig. 2c). a Calibration curves for the PAHBAH test comparing the standard protocol in tubes at varied incubation temperature and the HT protocol in MTPs. Conditions: Incubation in 1.5 ml tubes for 10 min, VL = 225 μL, n = 900 rpm, d0 = 3 mm, 100/85 °C (standard protocol). Incubation in 96well DWP for 10 min, VL = 225 μL, n = 900 rpm, 85 °C (HT protocol). Absorbance measurement at 410 nm. Error bars indicate standard deviation of three simultaneously performed assays. b Glucose equivalent formation during the hydrolysis of CMC incubated with 600 mU cellulase (EGII from Trichoderma longibrachiatum) or pure buffer solution measured via PAHBAH reducing sugar assay. Error bars indicate standard deviation of three simultaneously performed assays. Hydrolysis conditions: 96well DWP, VL = 200 μL, 10 g L−1 CMC in 0.1 M acetate buffer, pH = 4.8, 45 °C, n = 900 rpm, d0 = 3 mm. PAHBAH assay conditions according to the HT protocol described for Fig. 5a
