Fig. 2.

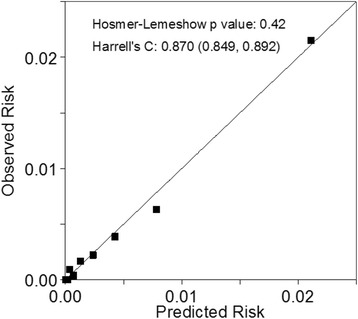
Calibration plot for the primary risk score model (based on sample data) applied to an arbitrary imputed dataset. Predicted risks were categorised into their tenths and observed risks computed within each of these tenths

Calibration plot for the primary risk score model (based on sample data) applied to an arbitrary imputed dataset. Predicted risks were categorised into their tenths and observed risks computed within each of these tenths