
Fig. 3.
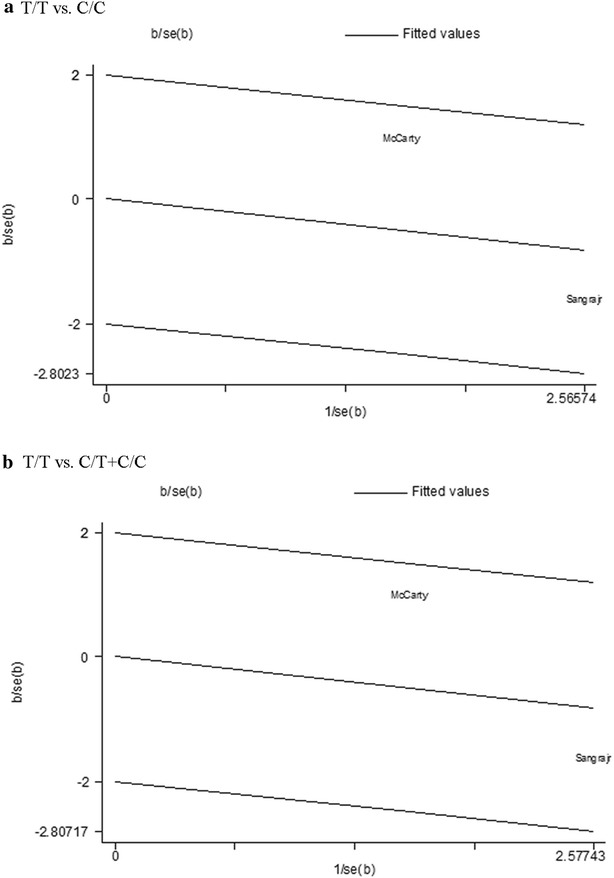
Galbraith plots of CYP2E1 gene polymorphisms and breast cancer (BC) risk in comparison models with significantly heterogeneity. a T/T vs. C/C in rs2031920 C>T polymorphism. b T/T vs. C/T + C/C in rs2031920 C>T polymorphism
Official websites use .gov
A
.gov website belongs to an official
government organization in the United States.
Secure .gov websites use HTTPS
A lock (
) or https:// means you've safely
connected to the .gov website. Share sensitive
information only on official, secure websites.
Galbraith plots of CYP2E1 gene polymorphisms and breast cancer (BC) risk in comparison models with significantly heterogeneity. a T/T vs. C/C in rs2031920 C>T polymorphism. b T/T vs. C/T + C/C in rs2031920 C>T polymorphism