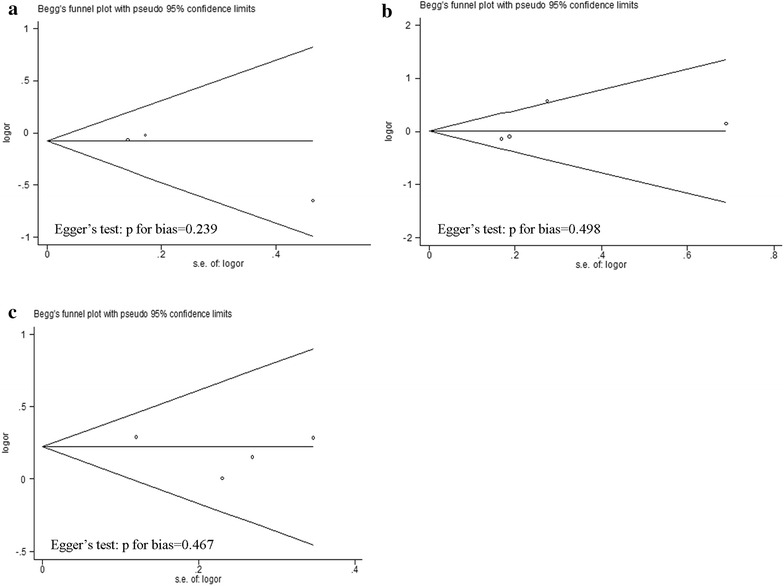
Fig. 4.

Begg’s funnel plot analysis and Egger’s test to detect publication bias. Each point represents a separate study for the indicated association. a Begg’s funnel plot analysis and Egger’s test for contrast T/T + C/T vs. C/C. b Begg’s funnel plot analysis and Egger’s test for contrast c2/c2 + c1/c2 vs. c1/c1. c Begg’s funnel plot analysis and Egger’s test for contrast C/C + D/C vs. D/D
