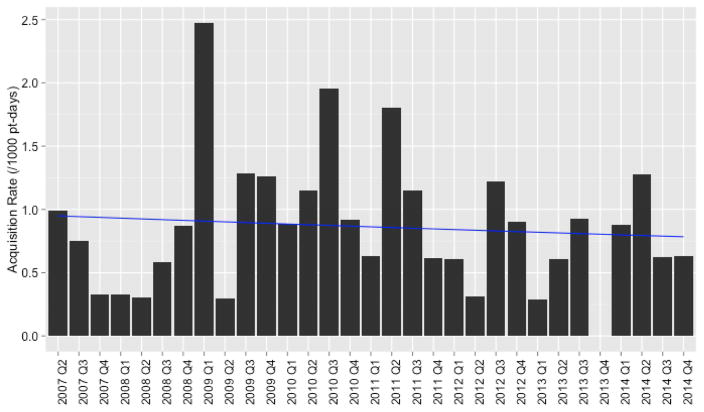
Figure 3.
Quarterly Incidence Rate of MRSA Colonization Acquisition During Study Period. Rates are reported per 1,000 patient-days. Figure depicts low-level, endemic transmission throughout study period. Poisson regression line shown in blue. There was not a significant downward trend in rate of incident MRSA colonization (p=0.62).

