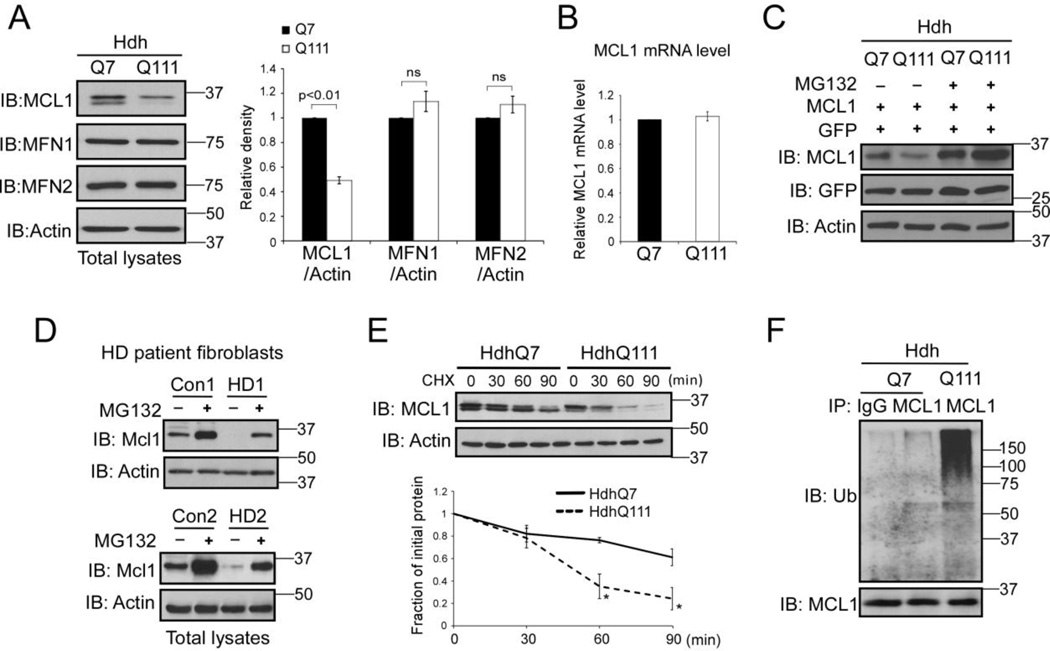
Figure 1. MCL1 is degraded in HD cell cultures via the UPS pathway.
(A) Total lysates of HdhQ7 and HdhQ111 mouse striatal cells were harvested. Protein levels of MCL1, MFN1, and MFN2 were determined by Western blot (WB) analysis using the indicated antibodies. Actin was used as a loading control. The data shown in the histogram are mean ± SE from three independent experiments. Student t-test. (B) RNA was extracted from HdhQ7 and HdhQ111 cells. The mRNA level of MCL1 was determined by real-time PCR. GAPDH was an internal control. The data are mean ± SE from three independent experiments. (C) HdhQ7 and HdhQ111 cells were co-transfected with MCL1 and GFP plasmids, followed by the addition of the proteasome inhibitor MG132 (5 µM for 16 hours). The MCL1 protein level was determined by WB. GFP was used as a control to ensure equal transfection efficiency among experimental groups. The shown blots are representative from three independent experiments. (D) HD patient fibroblasts (GM04693 and GM05539) and normal fibroblasts (Con1 and Con 2) were treated with or without MG132 (5 µM for 16 hours). Total lysates were subjected to WB analysis with the indicated antibodies. The shown blots are from three independent experiments. (E) Cycloheximide (CHX)-chase assay of MCL1 in HdhQ7 or HdhQ111 cells was conducted. The cells were treated with CHX at 50 µg/ml for the indicated time. The half-life of MCL1 was determined by WB. Actin was used as a loading control. The data are mean ± SE of three independent experiments. p<0.05, ANOVA with post-hoc Holm-Sidak test. (F) HdhQ7 and HdhQ111 cells were treated with MG132 (5 µM, 16 hours). Immunoprecipitation (IP) with anti-MCL1 antibody followed by WB with anti-ubiquitin (Ub) was performed. Note: the amount of protein used for IP in HdhQ111 cells was modified to ensure similar levels of MCL1 protein in each group (see input). The blots shown are from three independent experiments.

