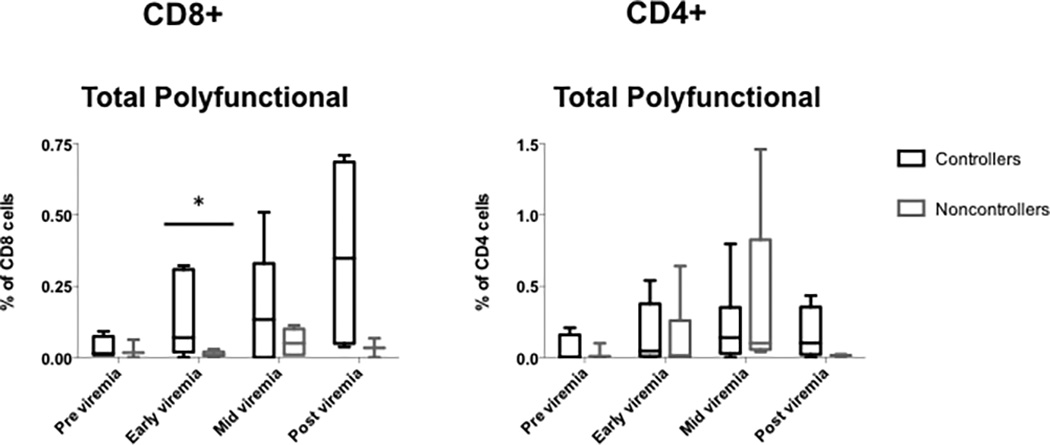
Figure 4. Increased frequency of polyfunctional T cells in BK virus controllers versus noncontrollers over time.

PBMCs were incubated with overlapping peptide pools representing all 5 BK virus expressed proteins and analyzed by intracellular cytokine analysis. Differences in frequency of CD4+ and CD8+ T cells were seen over time in the controller versus noncontroller or low level viremia groups. Box and whiskers plot drawn using the Tukey method. Panel A, total polyfunctional CD8+ T cells. Panel B, total polyfunctional CD8+ T cells. Single asterisk indicates p<0.05 by Wilcoxon test. Controllers are indicated in black, and noncontrollers in grey.
