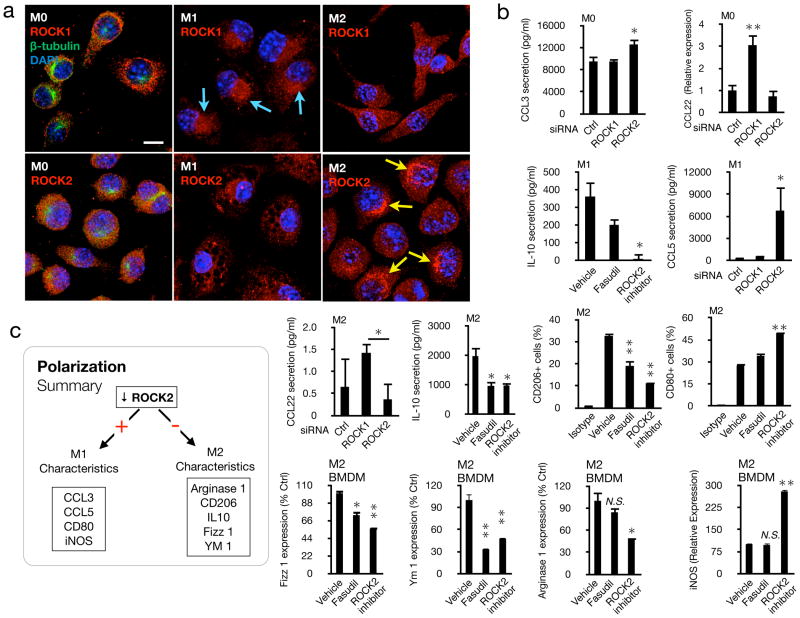
Figure 6. Isoform-specific inhibition of ROCK determines macrophage fate.
(a) Cellular localization of ROCK isoforms in polarized macrophages (M0, M1, M2). RAW 264.7 cells were differentiated into M0, M1, and M2 by cytokine treatment and used for immunostaining with Abs against ROCK1 or ROCK2 (red) , β-tubulin (green) and DAPI (blue). Arrowheads, vacuoles. Bar, 10μm. In a small number of M1 cells, ROCK2 was also found more concentrated around the nucleus. (b) ROCK isoforms were blocked in RAW 264.7, U937 and BMDM cells in M0-, M1-, or M2 environments. Chemokines, cell markers, and genes were quantified by luminex, flow cytometry, or rtPCR. Data represent average from three or more independent experiments. RT-PCR data was evaluated after subtraction of the specific endogenous control gene expression (18S rRNA). *P< 0.05; **P< 0.01 (c) Schematic overview of how ROCK signaling impacts polarization.

