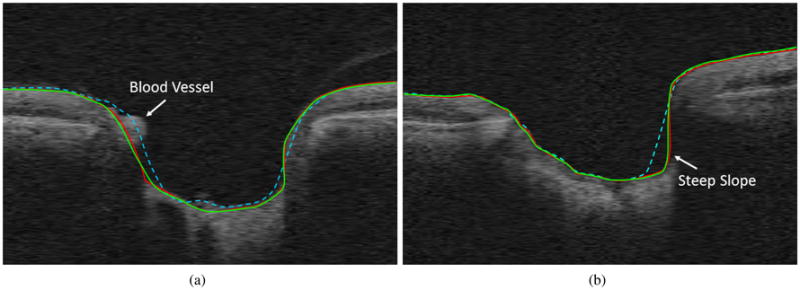
Figure 5.

Example results on the ONH portion of two slices from two volumes (only the ONH portion shown for better visibility). Red is the reference standard, green is the proposed algorithm and dashed cyan is Lee et al. [2] results. (a) Shows the effect of the presence of blood vessels and (b) shows an example of deep cupping.
