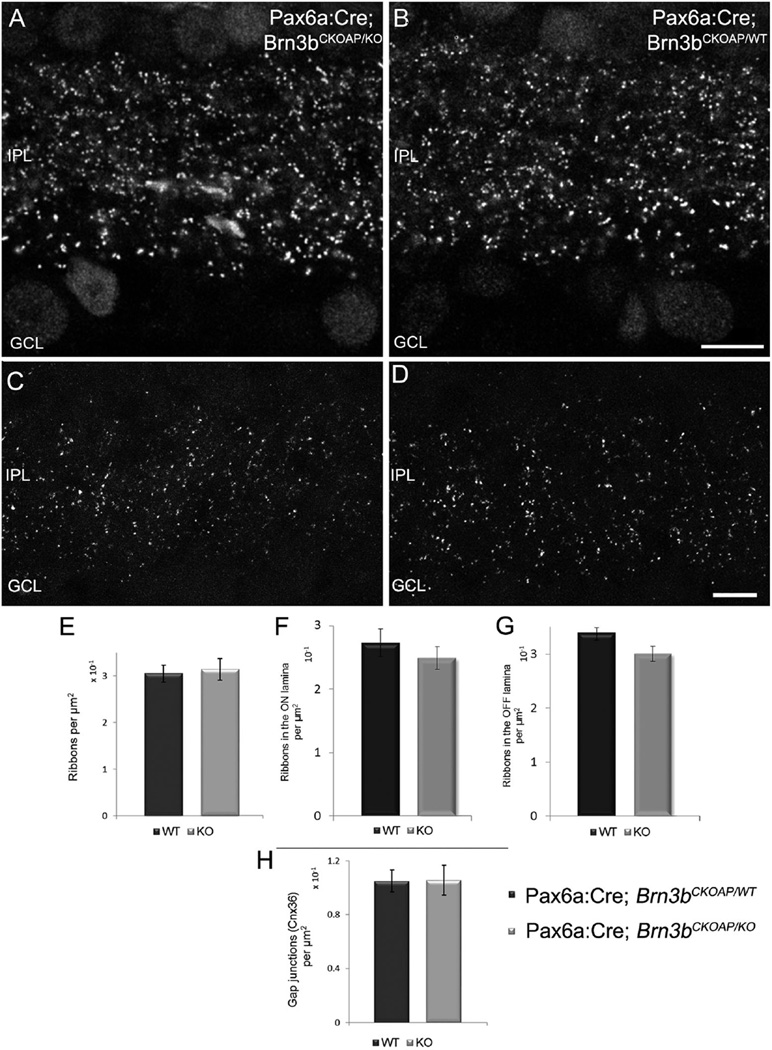
Figure 11.
Ribbons and gap junctions in the IPL. Confocal micrographs showing the distribution of ribbon synapses in the IPL of Pax6α: Cre; Brn3bCKOAP/KO (A) and Pax6α:Cre; Brn3bCKOAP/WT (B) retinas labeled with an antibody against CtBP2. Quantitative analysis showed no significant differences between the density of ribbons in the IPL of the two strains, P = 0.44 (C), when the entire thickness of the IPL was measured. No differences were observed also when the ON sublamina of the KO was compared with the one of the control, P = 0.179 (E); or in the case of the OFF sublaminae, P = 0.09 (F). Analogous data were obtained for estimates of the density of IPL gap junctions expressing Connexin36. Comparison of Pax6α:Cre; Brn3bCKOAP/KO and Pax6α:Cre; Brn3bCKOAP/WT animals returned a value of P = 0.99 (D). Scale bar = 10µm in B (applies to A,B); 5 µm in D (applies to C,D).

