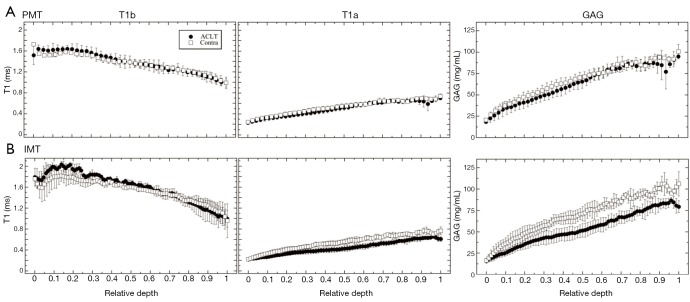
Figure 4.
The µMRI depth-dependent profiles of T1b, T1a, and GAG concentration for PMT (A) and IMT (B), respectively. The profiles are plotted in a relative depth where the articular surface is denoted as 0 and the bone is 1. The solid circles represent ACLT specimens and the open squares represent the contralateral specimens. The error bars are the standard deviations. Contra, contralateral; GAG, glycosaminoglycans; PMT, posterior medial tibia; IMT, interior medial tibia; ACLT, anterior cruciate ligament transection.

