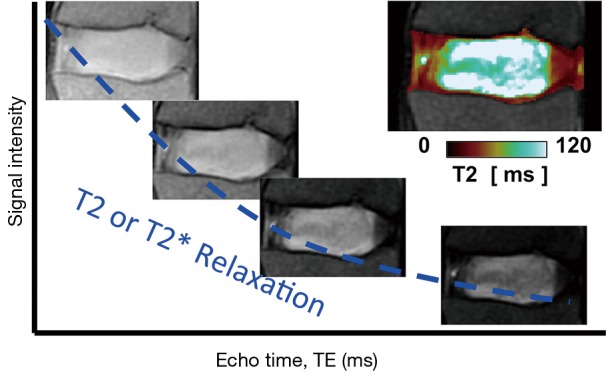
Figure 3.

An illustration of exponential fitting and color mapping of T2 or T2* relaxation values in an intervertebral disc. Images are obtained at multiple echo times (n=4 in this example), and signal intensity of each voxel is fit to an exponential decay model to obtain T2 or T2* value of the voxel to create a color map (insert).
