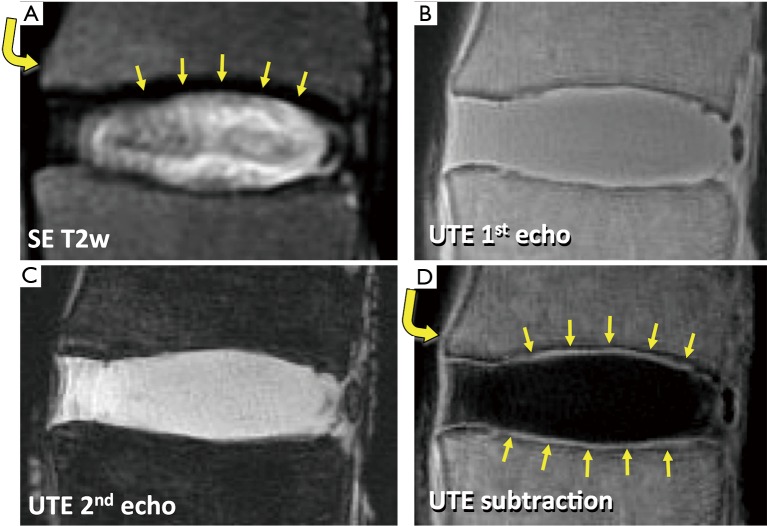
Figure 5.
Sagittal MR images of a lumbar disc segment obtained with (A) conventional spin echo sequence at TR of 2,000 ms and TE of 80 ms, 2-D UTE sequence at TR of 400 ms and TE of (B) 0.008 ms and (C) 5 ms, and (D) digital subtraction of UTE images (1st TE image minus 2nd TE image). On the spin echo image (A), structures including cartilaginous endplates (CEP) (arrows) and anterior longitudinal ligament (curved arrow) exhibit low signal intensity. After digital image subtraction (D), these short T2 tissues (arrows, curved arrow) are seen with high signal intensity and distinct from adjacent tissues.

