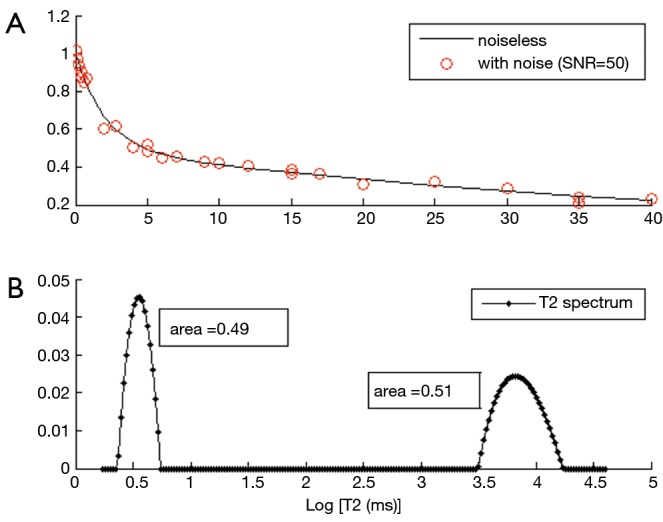
Figure 7.

Comparison of a bicomponent analysis vs. a distributed T2 spectrum analysis. (A) Bicomponent simulation was performed with a short T2 component (T2short =2 ms, short fraction =50%) and a long T2 component (T2long =50 ms, long fraction =50%), showing a noiseless decay signal (solid line) and noisy signal with signal-to-noise ratio of 50 (open circle); (B) distributed T2 spectrum analysis of the noisy data, performed using regularized non-negative least square method with a smoothness constraint, shows both short and long T2 components as spectra. The fraction of short and long T2 component can be obtained from the areas under each curve around the peaks.
