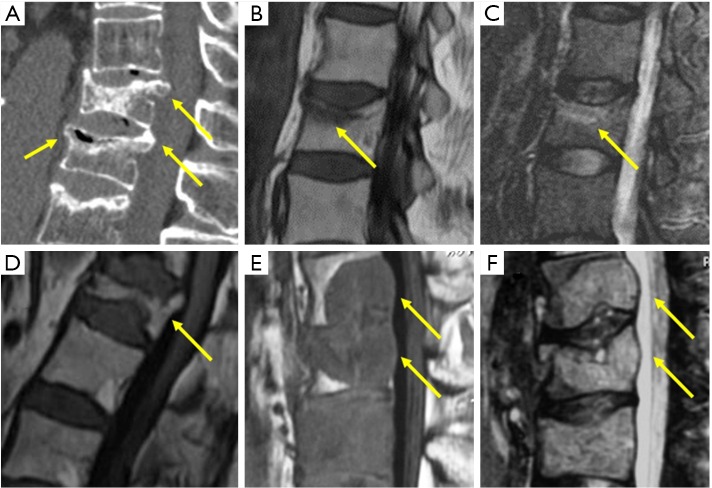
Figure 7.
(A) Sagittal MDCT with intravertebral cleft (anterior arrow) and retropulsed bone margins (posterior arrows). Sagittal T1 (B) and STIR (C) of band like edema in acute osteoporotic fracture. (D) Chronic osteoporotic fracture with vertebra deformity but normal marrow signal. Sagittal T1 (E) and STIR (F) of pathologic metastatic fractures with convex vertebral borders.

