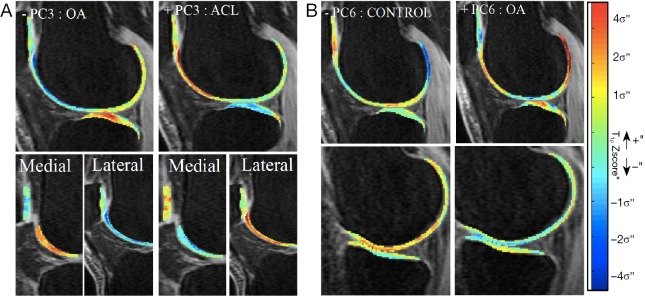
Figure 6.
Modeling of PC3 and PC6. (A) PC3: higher values of PC3 correspond to Z-score elevation in posterior lateral tibia and lateral trochlea. Lower values of PC3 correspond to Z-score elevation in central lateral tibia and medial trochlea; (B) PC6: higher values of PC6 correspond to Z-score elevation in posterior lateral femur and central lateral tibia. Lower values of PC6 correspond to Z-score reduction in posterior lateral femur. PC: principal component.

